PHPStorm TroubleShooting Guide
In this guide we go over PhpStorm step debugging a two part php file.

PHPStorm is (along with all of Jetbrains products) really amazing. However PHPStorm can be quite tricky to setup - because it relies on third-part php with either the zend or xdebug clients.
- It gets messy quick. If you are trying to get this to work you have come to the right place.
Mess Cleanup #1
- WHICH PHP.ini am I installing to? There are actually a PILE of php.ini files littered all over the /etc/php/ location.
- PHPStorm guide just says 'open php.ini' as in:

When you dig in you find out php.ini is installed all over the place, namely:
- /etc/php/8.2/apache2/php.ini
- /etc/php/8.2.apache2/conf.d/ has a pile of .ini and one for xdebug:

20-xdebug.ini holds one that needs to be disabled as it competes with xdebug (the one recommended by phpstorm)
We set it as:
[xdebug]
zend_extension=/usr/lib/php/20220829/xdebug.so
xdebug.mode=debug
xdebug.client_host=127.0.0.1
xdebug.client_port=9003
We were able to find the xdebug.so with:
find / -type f -name "xdebug.so" 2> /dev/nullWe now restart the php engine with:
sudo systemctl restart apache2But we can see we are loading Xdebug about three times so various entities are overpopulating the config files:
We can search all off these with:
grep -rni zend_extension
Which shows us our culprits:

Now we are down to one extraneous call as in:

Inside mods-available we have:

Much cleaner - but thats only the first part done:

Its still not actually listing Xdebug as the preferred extension (as per the website)

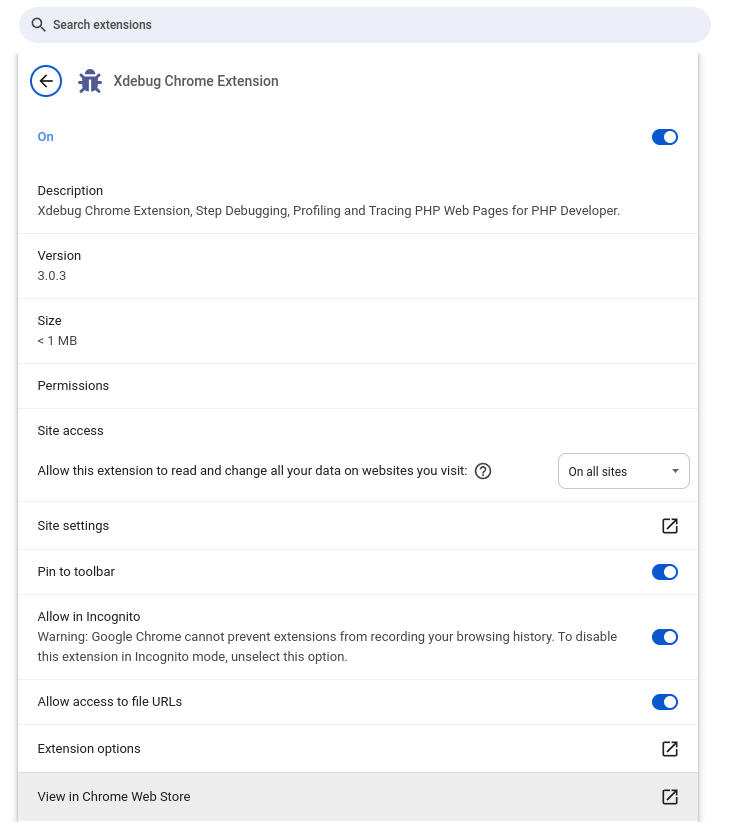
Now it starts work, but wait there is more - Next you need to set your extension in Google-Chrome (or Firefox) for Xdebug, namely:

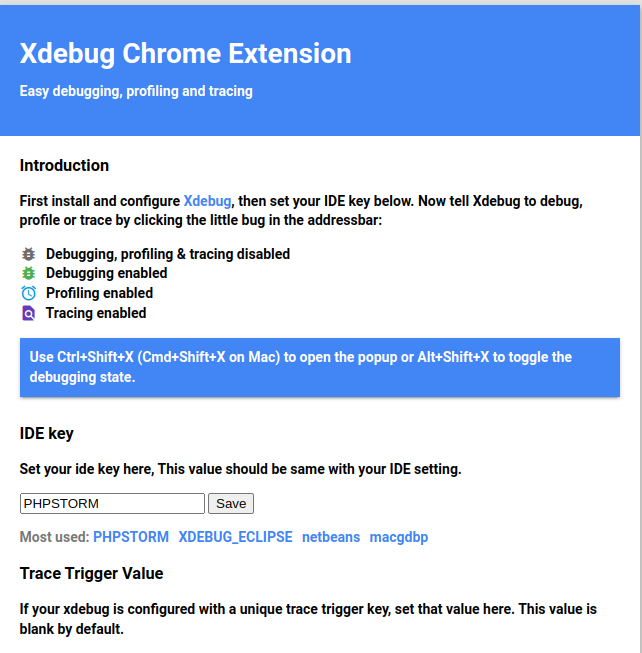
Inside extension options you need to set your key for phpstorm as in:

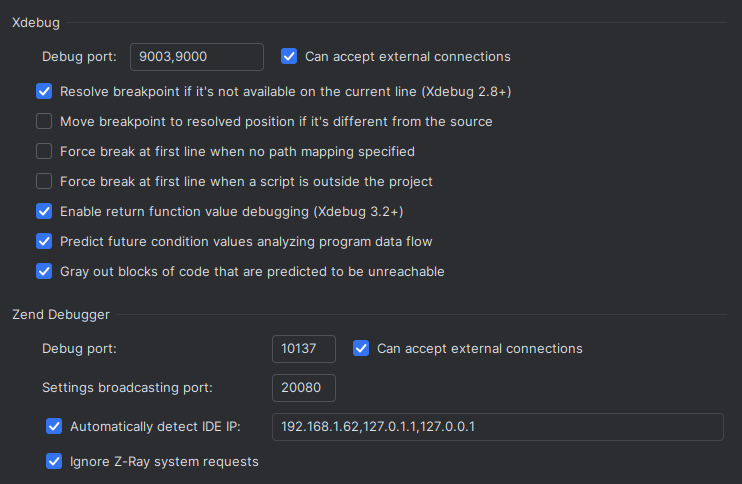
In PHPStorm the settings seem to suggest confliction (as the two of them block each other as in:

Or not - they seem to be using different ports:
In Server settings there are more things that can be tried. One really needs a much more detailed guide of all the stuff that this is doing but here is another screen shot:

- Typically when you read a guide on the internet they have simply tried a bunch of stuff and remembered the last thing that worked that might be a pile of stuff. One does not know.
FINALLY It's working. It is highly unintuitive of what is occuring here, but in essence we have the following:
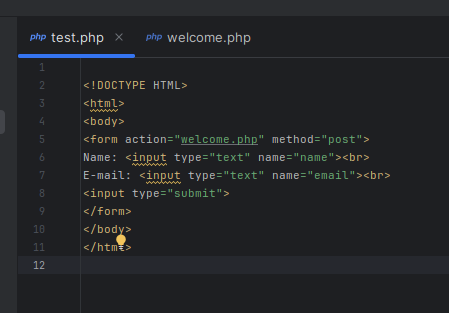
- The first page test.php is making a small form it is being launched from PHPStorm under the debug conditions which is programmed to call a second page welcome.php

In the upper right will be the google-chrome button which will launch this.
The small form will show up as:

- But what happens if it does not show up - this occurs because their may be already a single open intercept on the welcome.php which shows up at the bottom. You have to stop it first:

But that is the beauty of it - it is actually working.
Summary: Step-debugging a PHPStorm / Google-Chrome / XDebug / PHP setup is messy. It is a specialized thing to get started, but step-debugging is a MUST if you are going to build anything appreciably production.

